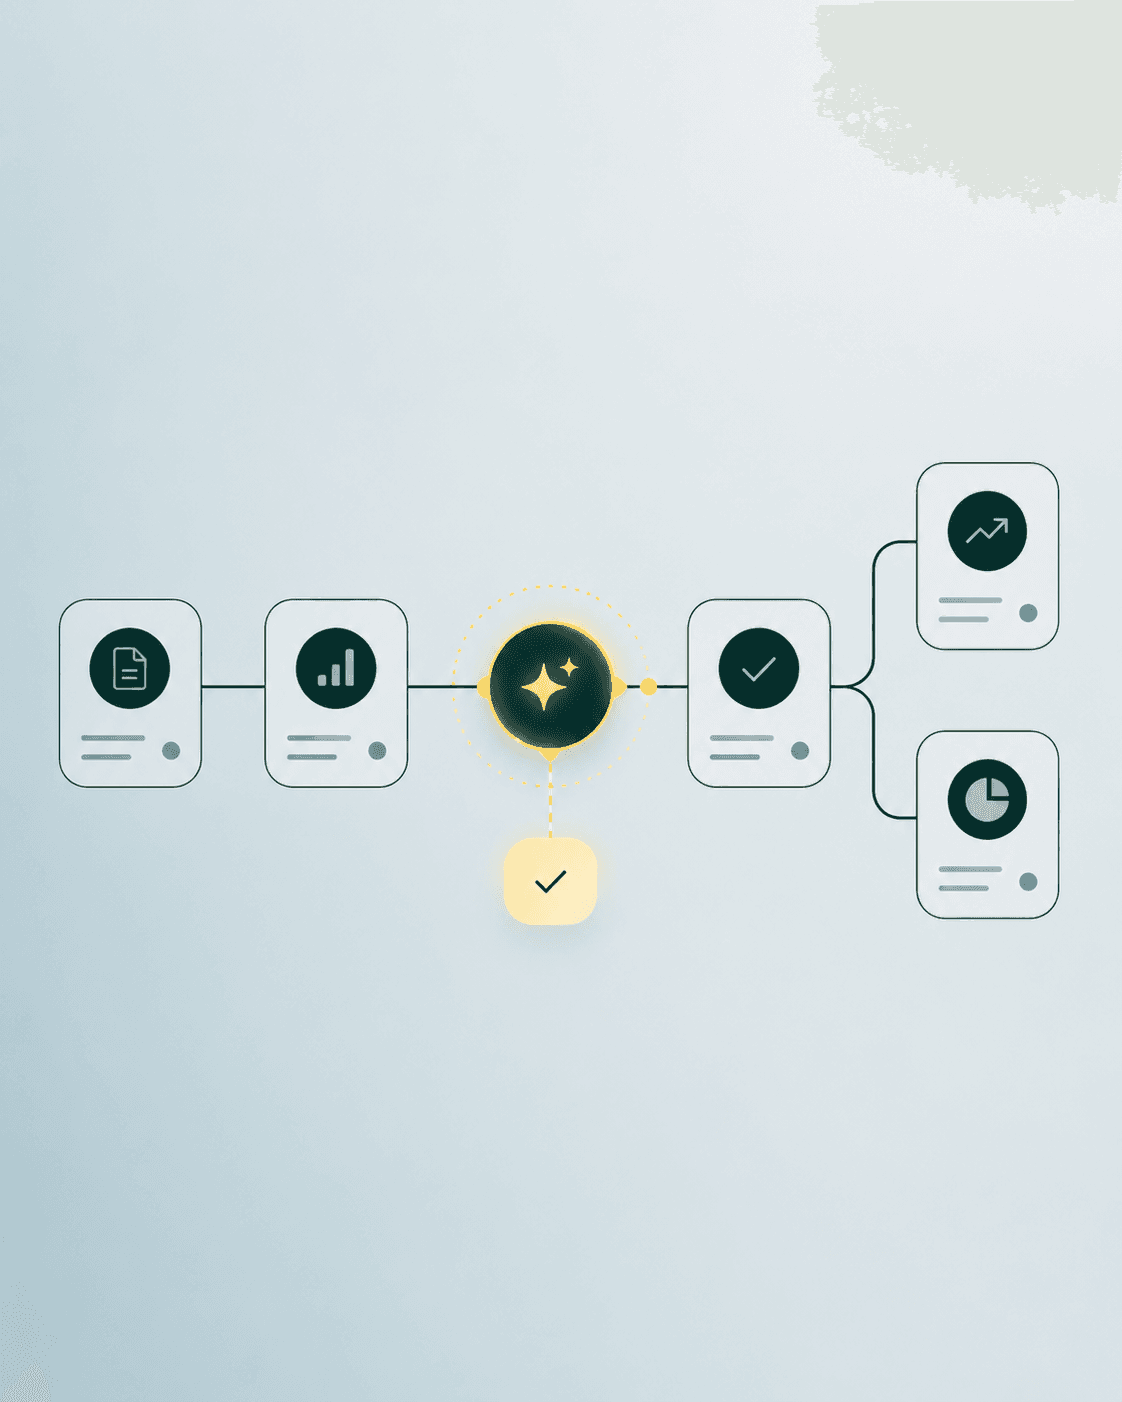
Anyone who has to switch between different platforms for every analysis loses time and rarely gets a consistent picture of marketing performance. Google Looker Studio can visualize data from various sources in a centralized, interactive dashboard. However, the crucial work begins before creating the chart: with a clear question, clean data sources, suitable KPIs, and consistent data logic. Data Flakes supports custom dashboard development with Looker Studio tailored to your requirements.
What is Google Looker Studio?
Google Looker Studio is a reporting and visualization tool used to bring together data from various sources into dashboards. Typical sources include Google Analytics 4, Google Ads, Search Console, Google Sheets, and BigQuery. Additional marketing platforms can be connected as needed via suitable connectors, APIs, or upstream data sources. Not every connection is available natively or for free.
What is Looker Studio suitable for?
Looker Studio is suitable for marketing reporting, performance marketing, web analytics, e-commerce reporting, SEO reporting, management dashboards, campaign evaluations, funnel analyses, and conversion reporting. The value lies in answering recurring questions quickly and comprehensibly: Which channels deliver qualified leads? How is revenue trending? Which landing pages and campaigns contribute to the results?
How should a good Looker Studio dashboard be structured?
A sensible structure follows the depth of decision-making. Level one is a management overview with a few KPIs such as sessions, conversions, revenue, cost, ROAS, conversion rate, or leads—only if they fit the business model. Level two shows channel performance for organic, paid search, paid social, direct, referral, or email. Level three delves into campaigns, and level four maps a funnel, such as Session → Product View → Cart → Checkout → Purchase or Session → Landing Page → CTA → Form → Lead.
The fifth level is the detailed analysis by device, landing page, campaign, region, product, or target audience. Not every dashboard needs all levels on a single page. Good dashboards guide the user from a clear overview to the specific details truly needed to explain an anomaly.
Connecting GA4 to Looker Studio
GA4 can be used as a data source in Looker Studio. Dimensions and metrics for events, key events, traffic sources, landing pages, users, and sessions are available. Not every desired analysis can be sensibly mapped directly via this data source. For more complex requirements, other data architectures may be more suitable. A solid foundation is established with GA4 conversion tracking.
Analyzing Google Ads in Looker Studio
For Google Ads, impressions, clicks, cost, CPC, conversions, conversion value, ROAS, campaign, and ad group are typical metrics. A report only becomes meaningful once conversion definitions and campaign goals have been properly established from a business perspective. A dashboard cannot decide which conversion is strategically important; however, it can make that decision transparent.
Combining GA4 and Google Ads in a single dashboard
Google Ads provides cost, clicks, and campaign context. GA4 provides website behavior, sessions, events, and conversions. Together, they create a more comprehensive picture. However, the metrics from both systems do not have to be identical: attribution, date ranges, consent, processing, and definitions can differ. Therefore, always compare the same question, not just two similarly named figures.
Consolidating multiple marketing channels in Looker Studio
Google Ads, Meta Ads, LinkedIn Ads, GA4, Search Console, CRM, and shop data can all be part of cross-channel reporting. Depending on the source, third-party connectors, APIs, BigQuery, Google Sheets, or data pipelines may be required. What matters most is not the number of sources, but having a clear set of rules for where data originates and how it is made comparable.
Why the data model is more important than the dashboard
A beautiful dashboard does not fix bad data. Inconsistent campaign names, conversion definitions, date ranges, and attributions produce misleading reports. Google Ads may describe a channel differently than Meta, GA4 may use a different attribution model, and CRM data may follow another definition of a lead. Before visualization, KPIs, data sources, granularity, comparable dimensions, and non-additive values must be clearly defined. Reporting starts with the data model, not the chart.
Looker Studio and BigQuery
For larger or more complex volumes of data, BigQuery can serve as a centralized data repository: Marketing Platforms → Data Pipeline → BigQuery → Looker Studio. Benefits can include centralized data logic, custom calculations, historical data, and cross-channel models. For simple reports, a direct data source is often completely sufficient. The right architecture emerges from your questions, data volumes, and requirements—not from a blanket judgment about tools.